Getting Started
Contents
- Opening a file
- Examining a smaller region
- Plotting
- Performing spectral analysis
- Generating dynamic spectrograms
Opening a file
For a description of accepted file types, visit this link.
1. Start MagPy and the following startup screen should be visible:
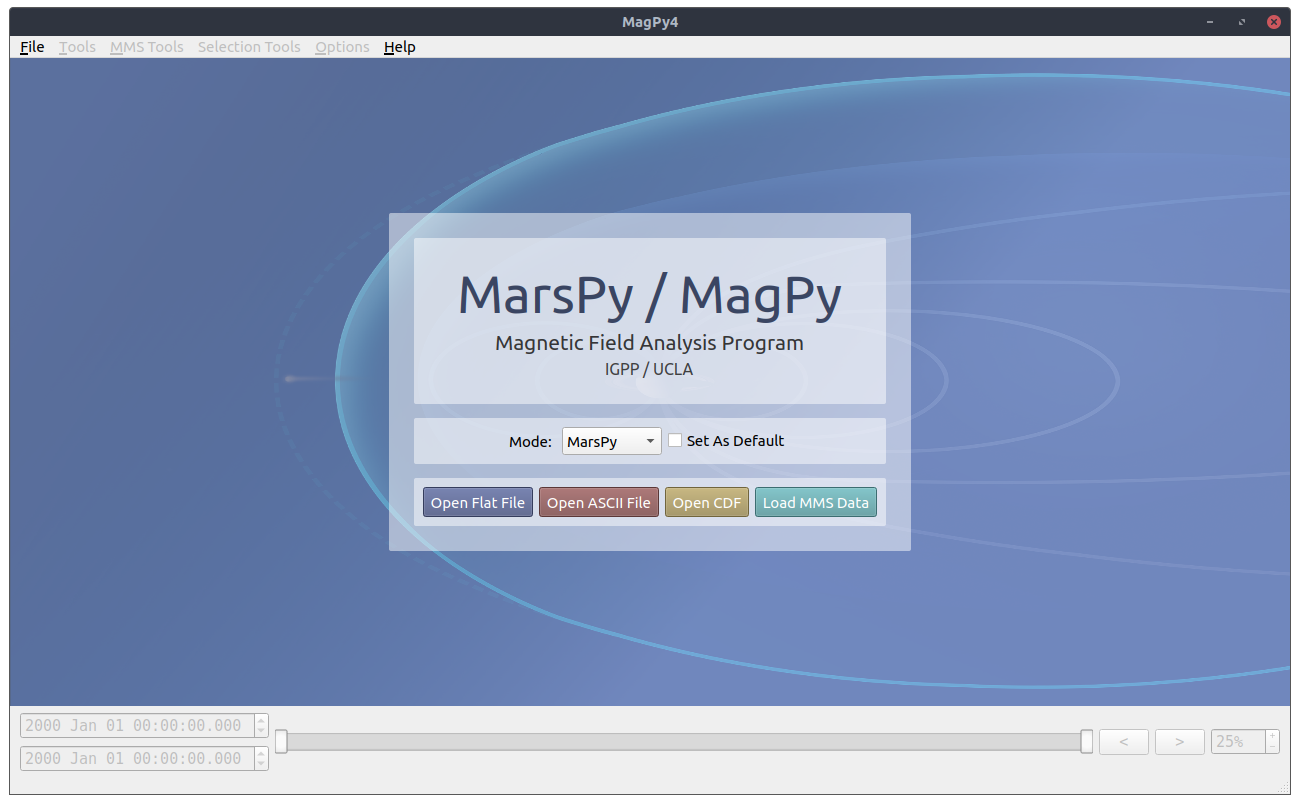
2. To open a file, click on the corresponding button, such as ‘Open Flat File’ for a flat file. Your system’s file manager should open up a window to select a file like so:
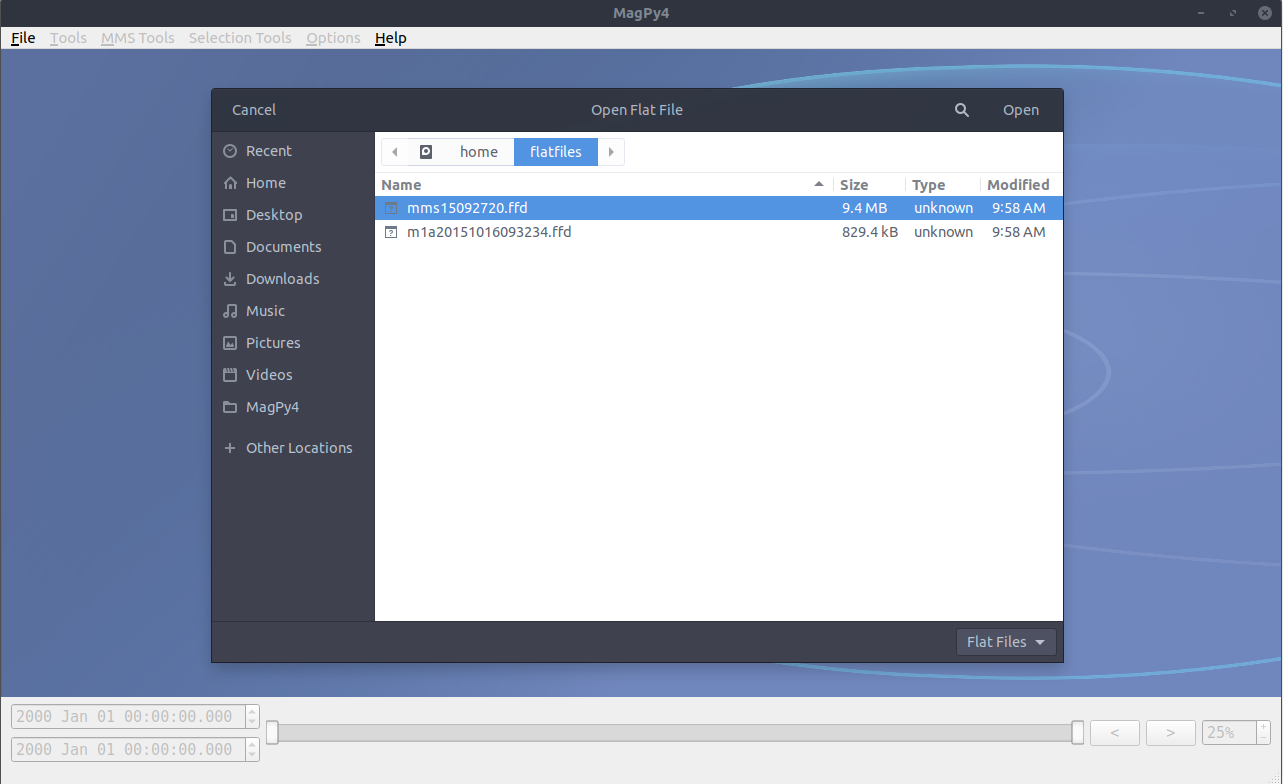
Select the file(s) you would like to open and press ‘Open’.
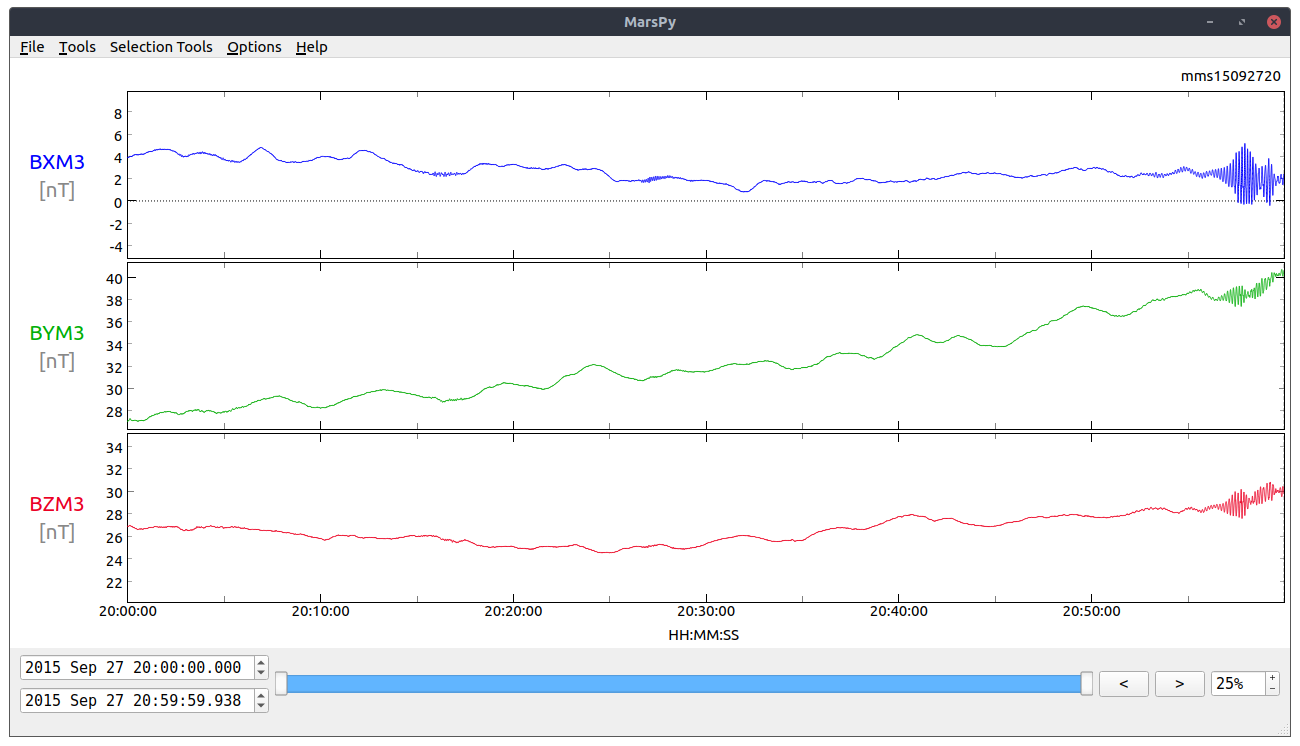
3. Wait a few seconds (or up to a few minutes for very large files) and the data should be loaded so you see a few plotted panels like this:
Examining a smaller region
Using the slider
- Click and drag the left handle on the bottom blue slider to the specified start time.
- Click and drag the right handle on the slider to the specified end time.
Using the time edits
- Click on the topmost time editor in the bottom left corner of the screen and enter the start timestamp.
- Click on the bottom time editor and enter the end timestamp.
Shifting the window
To move the plot region backwards or forwards in time, use the left or right buttons
in the bottom right corner of the screen:
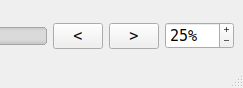
The percentage reflects the percentage of the window width to shift the window left or right by. For example, if the view range is 1 hour long and the percentage is set to 50%, the window will be shifted by 30 minutes.
The left and right arrow keys on your keyboard also do the same thing.
Plotting
- Open up the Plot Menu tool under the Tools section in the menu bar. The following
window should open up:
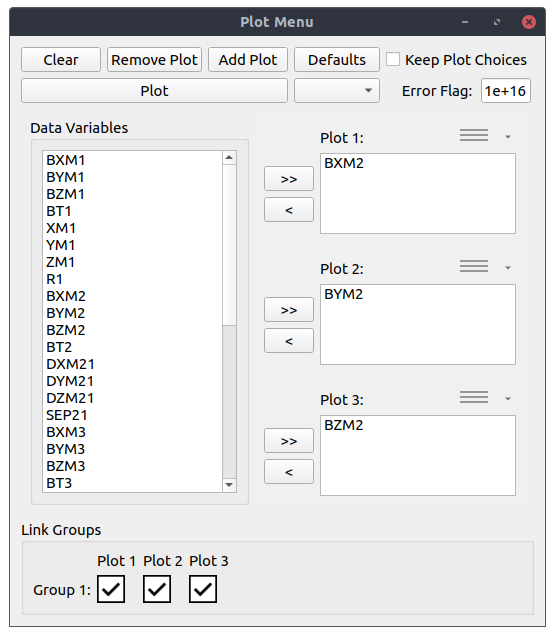
- Add or remove plots by clicking on the Add Plot or Remove Plot buttons at the top.
- Select variables from the Data Variables section and click on the ‘>>’ buttons
to add them to a given plot.
You may also select variables in a given plot to remove by clicking ‘<’ next to the chosen plot. - The Link Groups section reflects groups of plots that should be scaled to have the
same size view range.
In the example above, plots 1, 2, and 3 will have the same scale. - Press the Plot button to plot your selections.
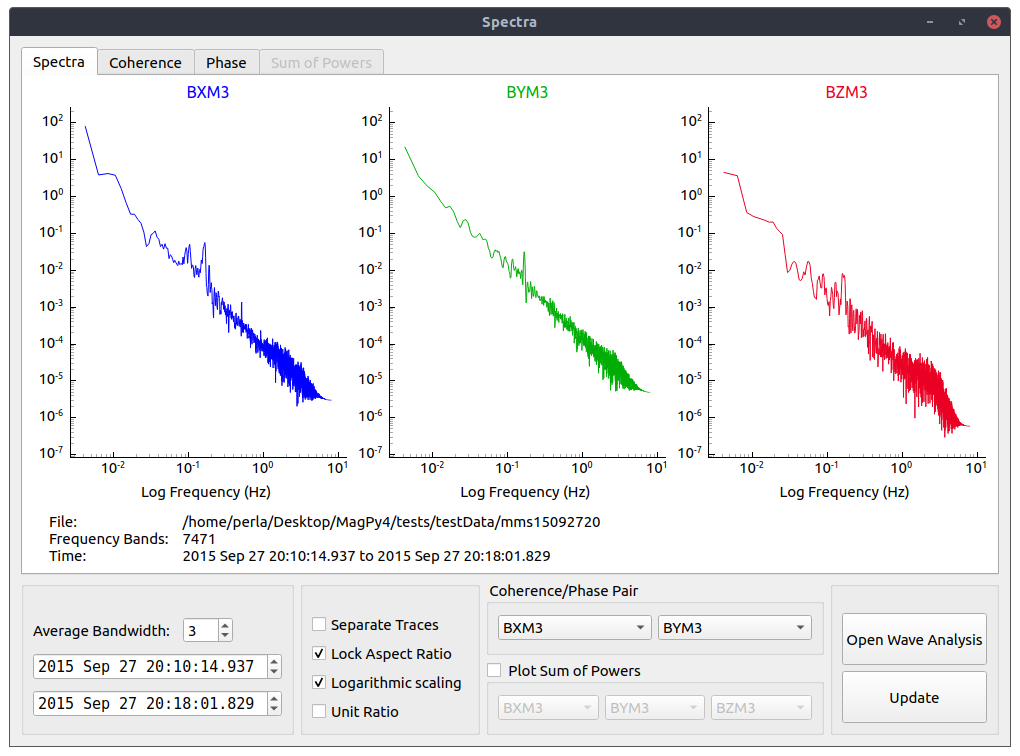
Performing spectral analysis
- Click on the Spectra tool in the Tools menu.
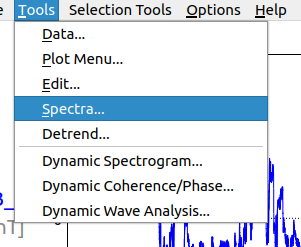
-
Select the start and end times on the actual plot grid:
- The following window should open up:
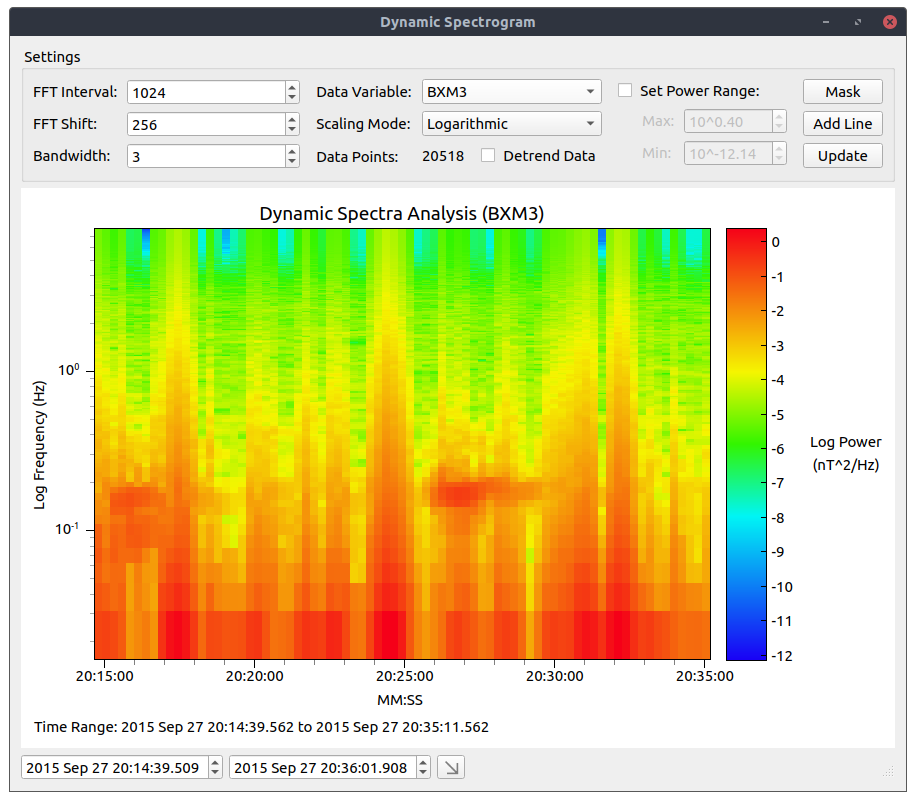
Generating dynamic spectrograms
- Click on the Dynamic Spectra tool in the Tools menu.
- Select the start and end times on the plot grid in the same manner for selecting spectra.
- A spectrogram window should open up similar to the following: